Tarot visuals are no longer limited to traditional card illustrations—today, creators, readers, and educators can use AI to generate sophisticated Tarot Archetype Relationship Charts. These charts visually map how different archetypes interact, influence, or challenge each other, making them ideal for workshops, readings, courses, blogs, and spiritual content creation.
In this guide, you’ll learn how to use Nano Banana Pro to design photorealistic, symbolic, and visually compelling Tarot relationship charts, step by step. Perfect for: tarot readers, spirituality creators, mystical illustrators, and educators.
Why Use Nano Banana Pro for Tarot Charts?
Nano Banana Pro excels at:
- Photorealistic visual symbols
- Elegant infographic layouts
- Complex relational diagrams
- Mystical, symbolic, or esoteric aesthetics
- Precise control over color harmony & mood
It’s the perfect model to build visually coherent, emotionally rich Tarot archetype graphics.
How to Create a Tarot Archetype Relationship Chart With Nano Banana Pro
Step 1: Decide the Archetypes You Want to Compare
Choose 2–5 tarot cards whose relationship you want to visualize. For instence:
- The Fool + The Magician
- The Empress + The Emperor
- Death + The Tower
- The High Priestess + The Hermit
Step 2: Choose a Visual Style.
You can create charts that are:
- Photorealistic
- Vintage tarot-style
- Minimalist modern diagrams
- Mystical gold-foil illustrations
- Soft ethereal pastel aesthetics
Step 3: Use Structured Prompting.
Nano Banana Pro works exceptionally well with structured prompts:
- Theme
- Archetypes involved
- Relationship direction (flows, cycles, tensions)
- Color palette
- Symbols
- Composition
- Infographic elements
Step 4: Generate & Refine
Generate several variations until you find a chart that feels spiritually resonant and visually coherent.
Tarot Archetype Relationship Chart Examples
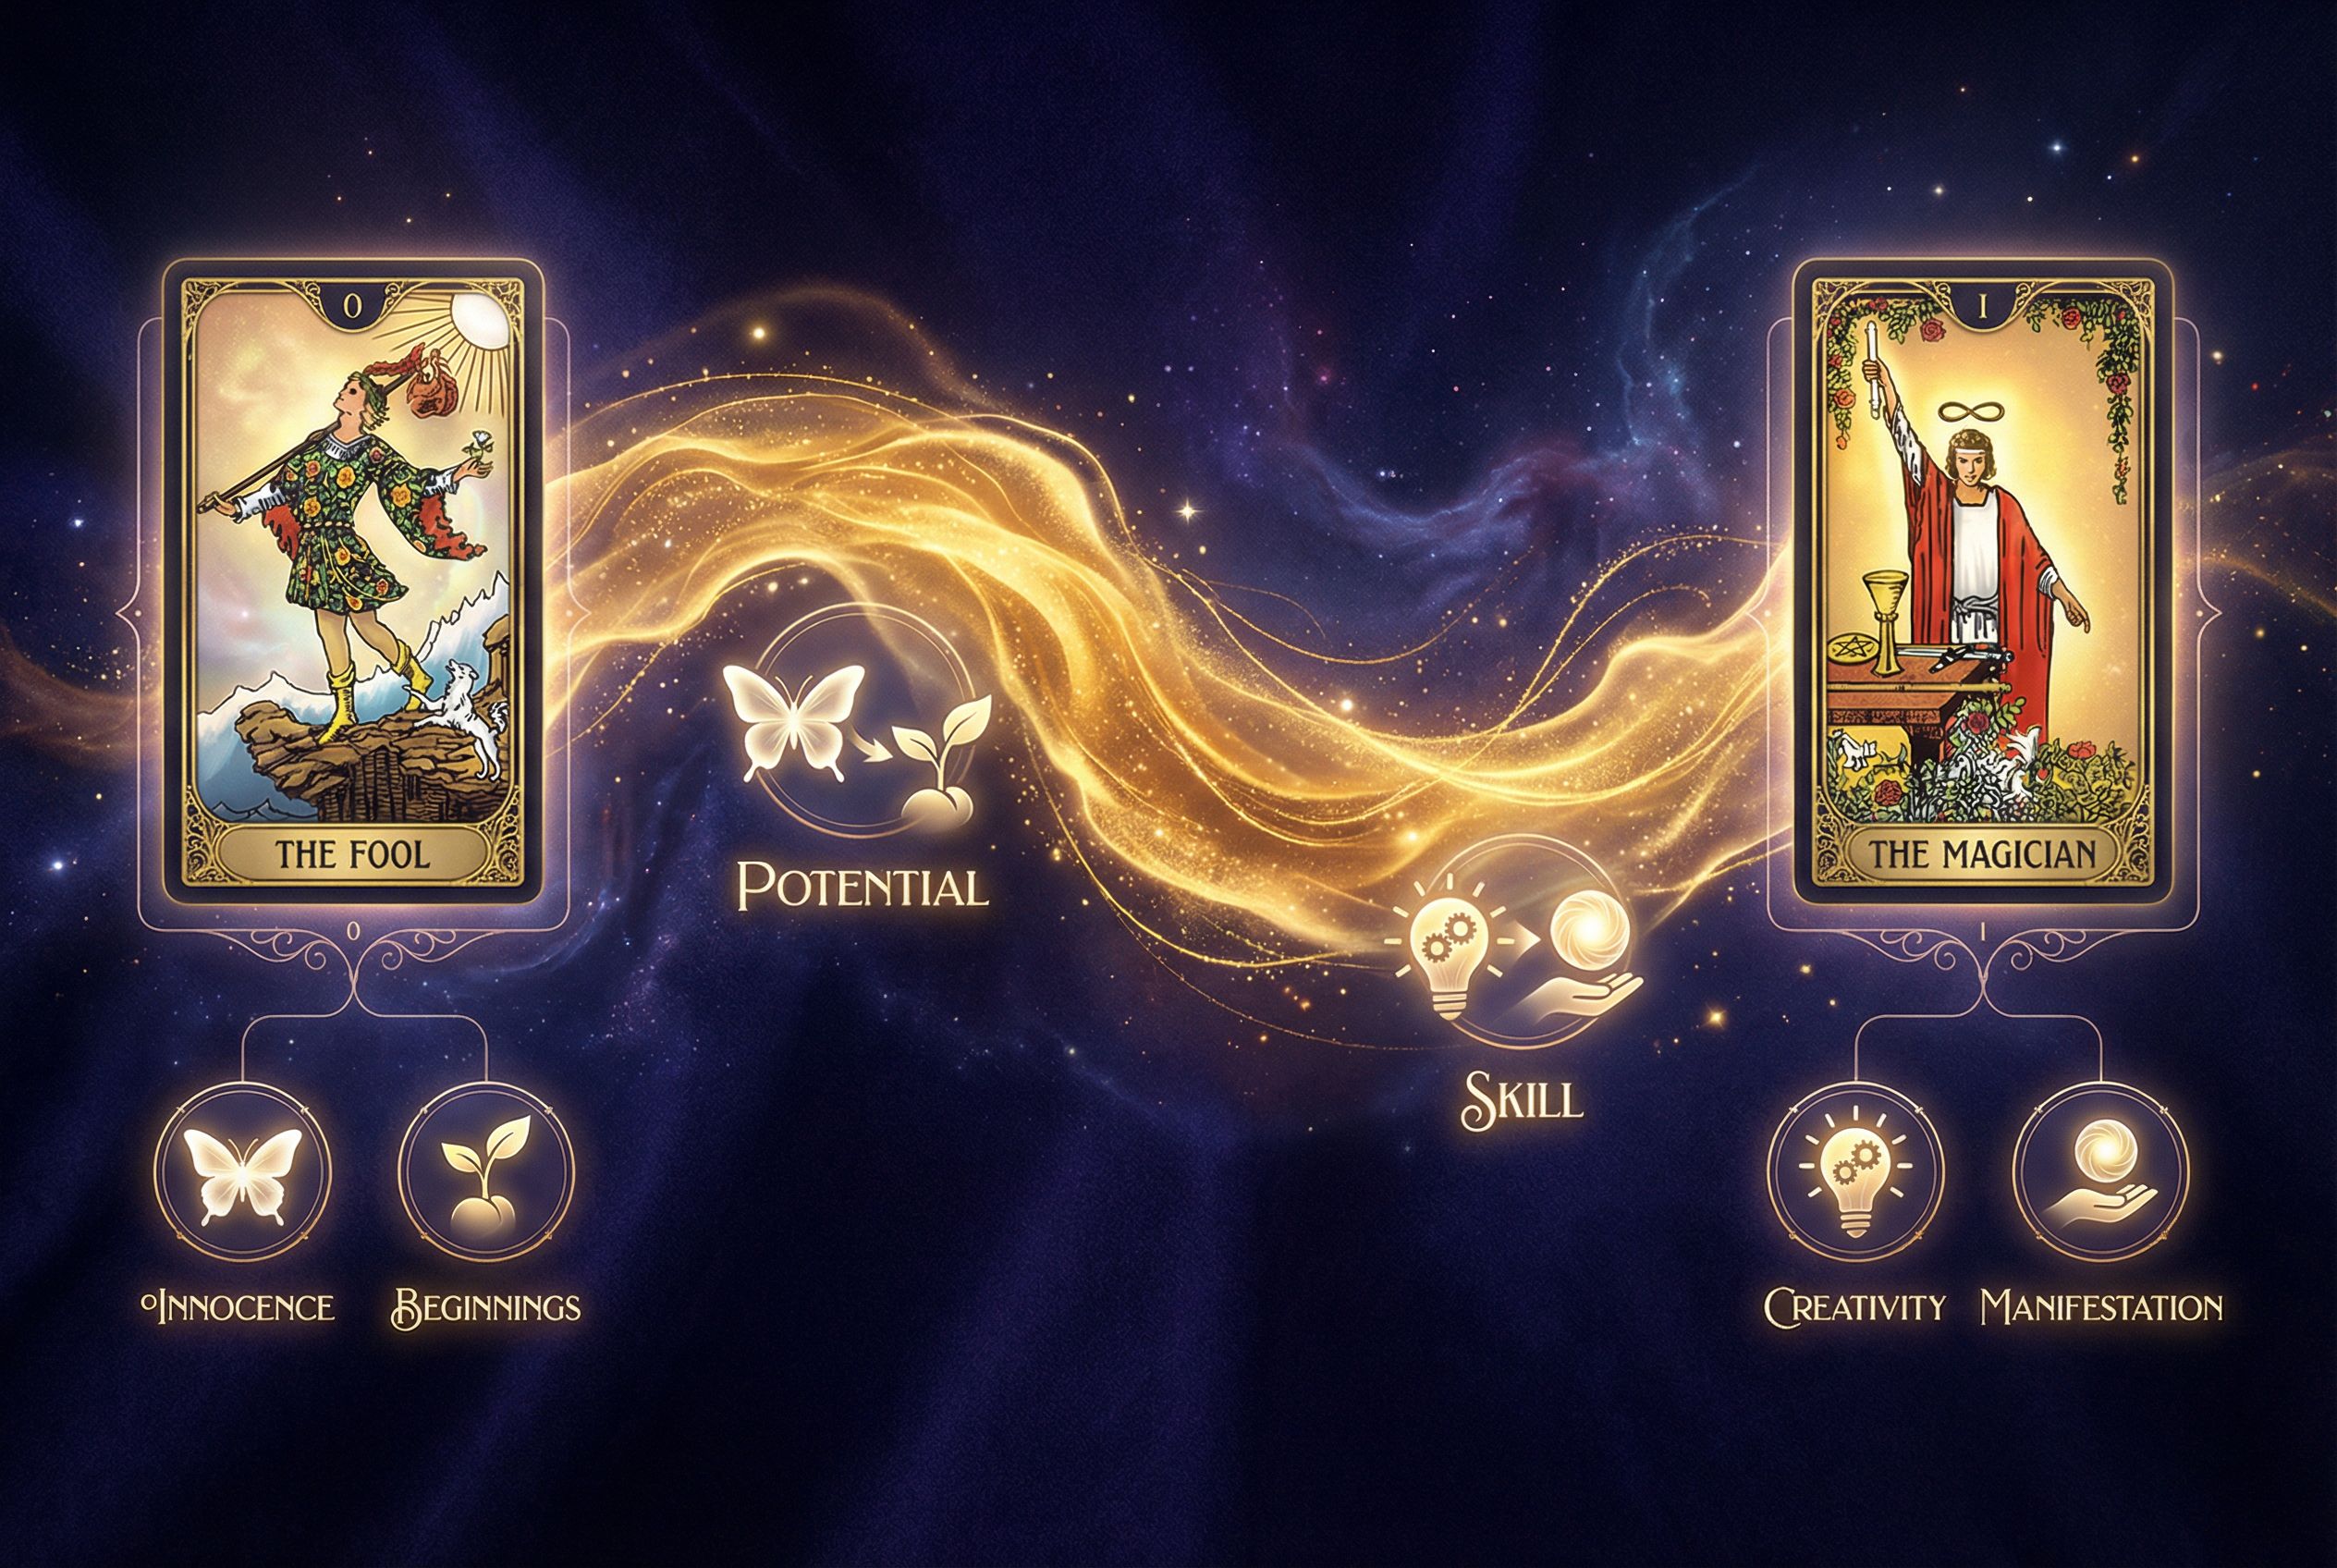
Example1: The Fool → The Magician — “Potential Becomes Power”
Prompt:
Photorealistic tarot archetype relationship chart showing The Fool on the left and The Magician on the right. Visualize a flowing golden energy path connecting them, representing potential transforming into skill. Include icons for innocence, beginnings, creativity, and manifestation. Soft mystical lighting, deep indigo background, clean infographic layout, 4K resolution.
Example2: The Lovers ↔ The Devil — “Desire and Shadow Duality”
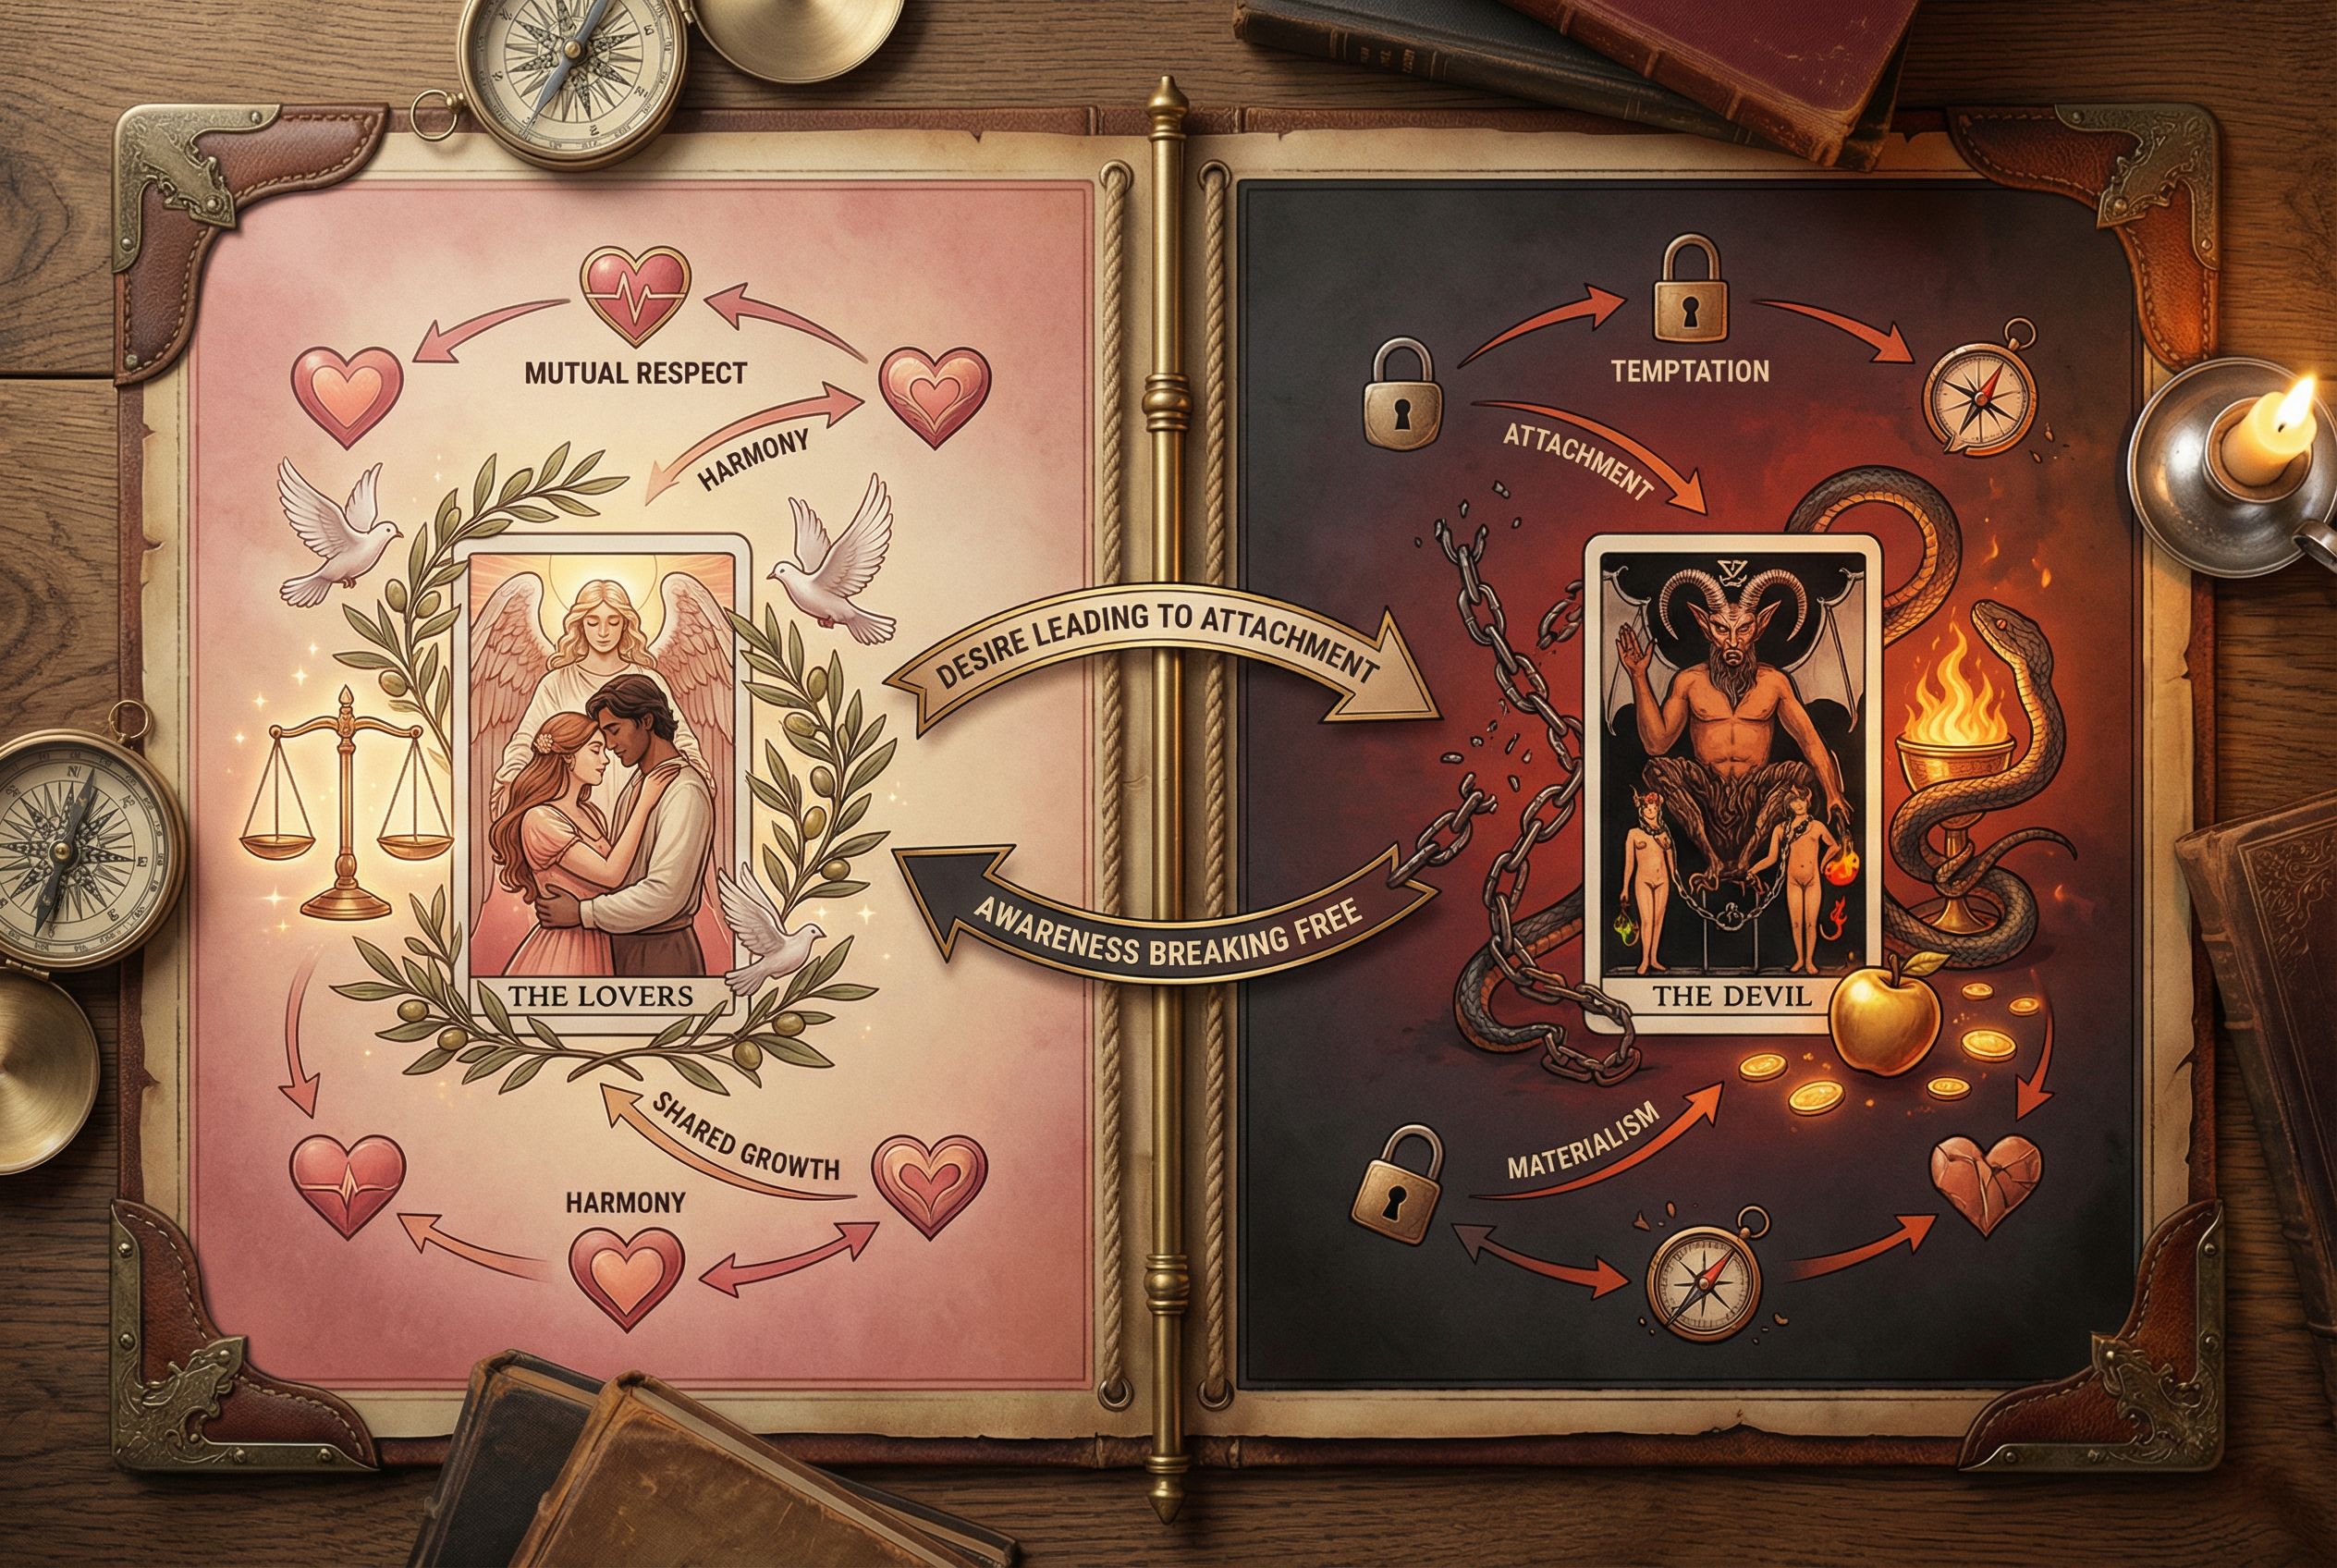
Prompt:
A photorealistic tarot relationship chart contrasting The Lovers and The Devil. Use a central split line: left side bright, soft pink tones with harmony symbols; right side dark crimson with chains and temptation symbols. Add arrows showing mutual influence, desire leading to attachment, awareness breaking free. Elegant infographic style, cinematic lighting.
Example3: Death → The Tower — “Transformation Before Collapse”
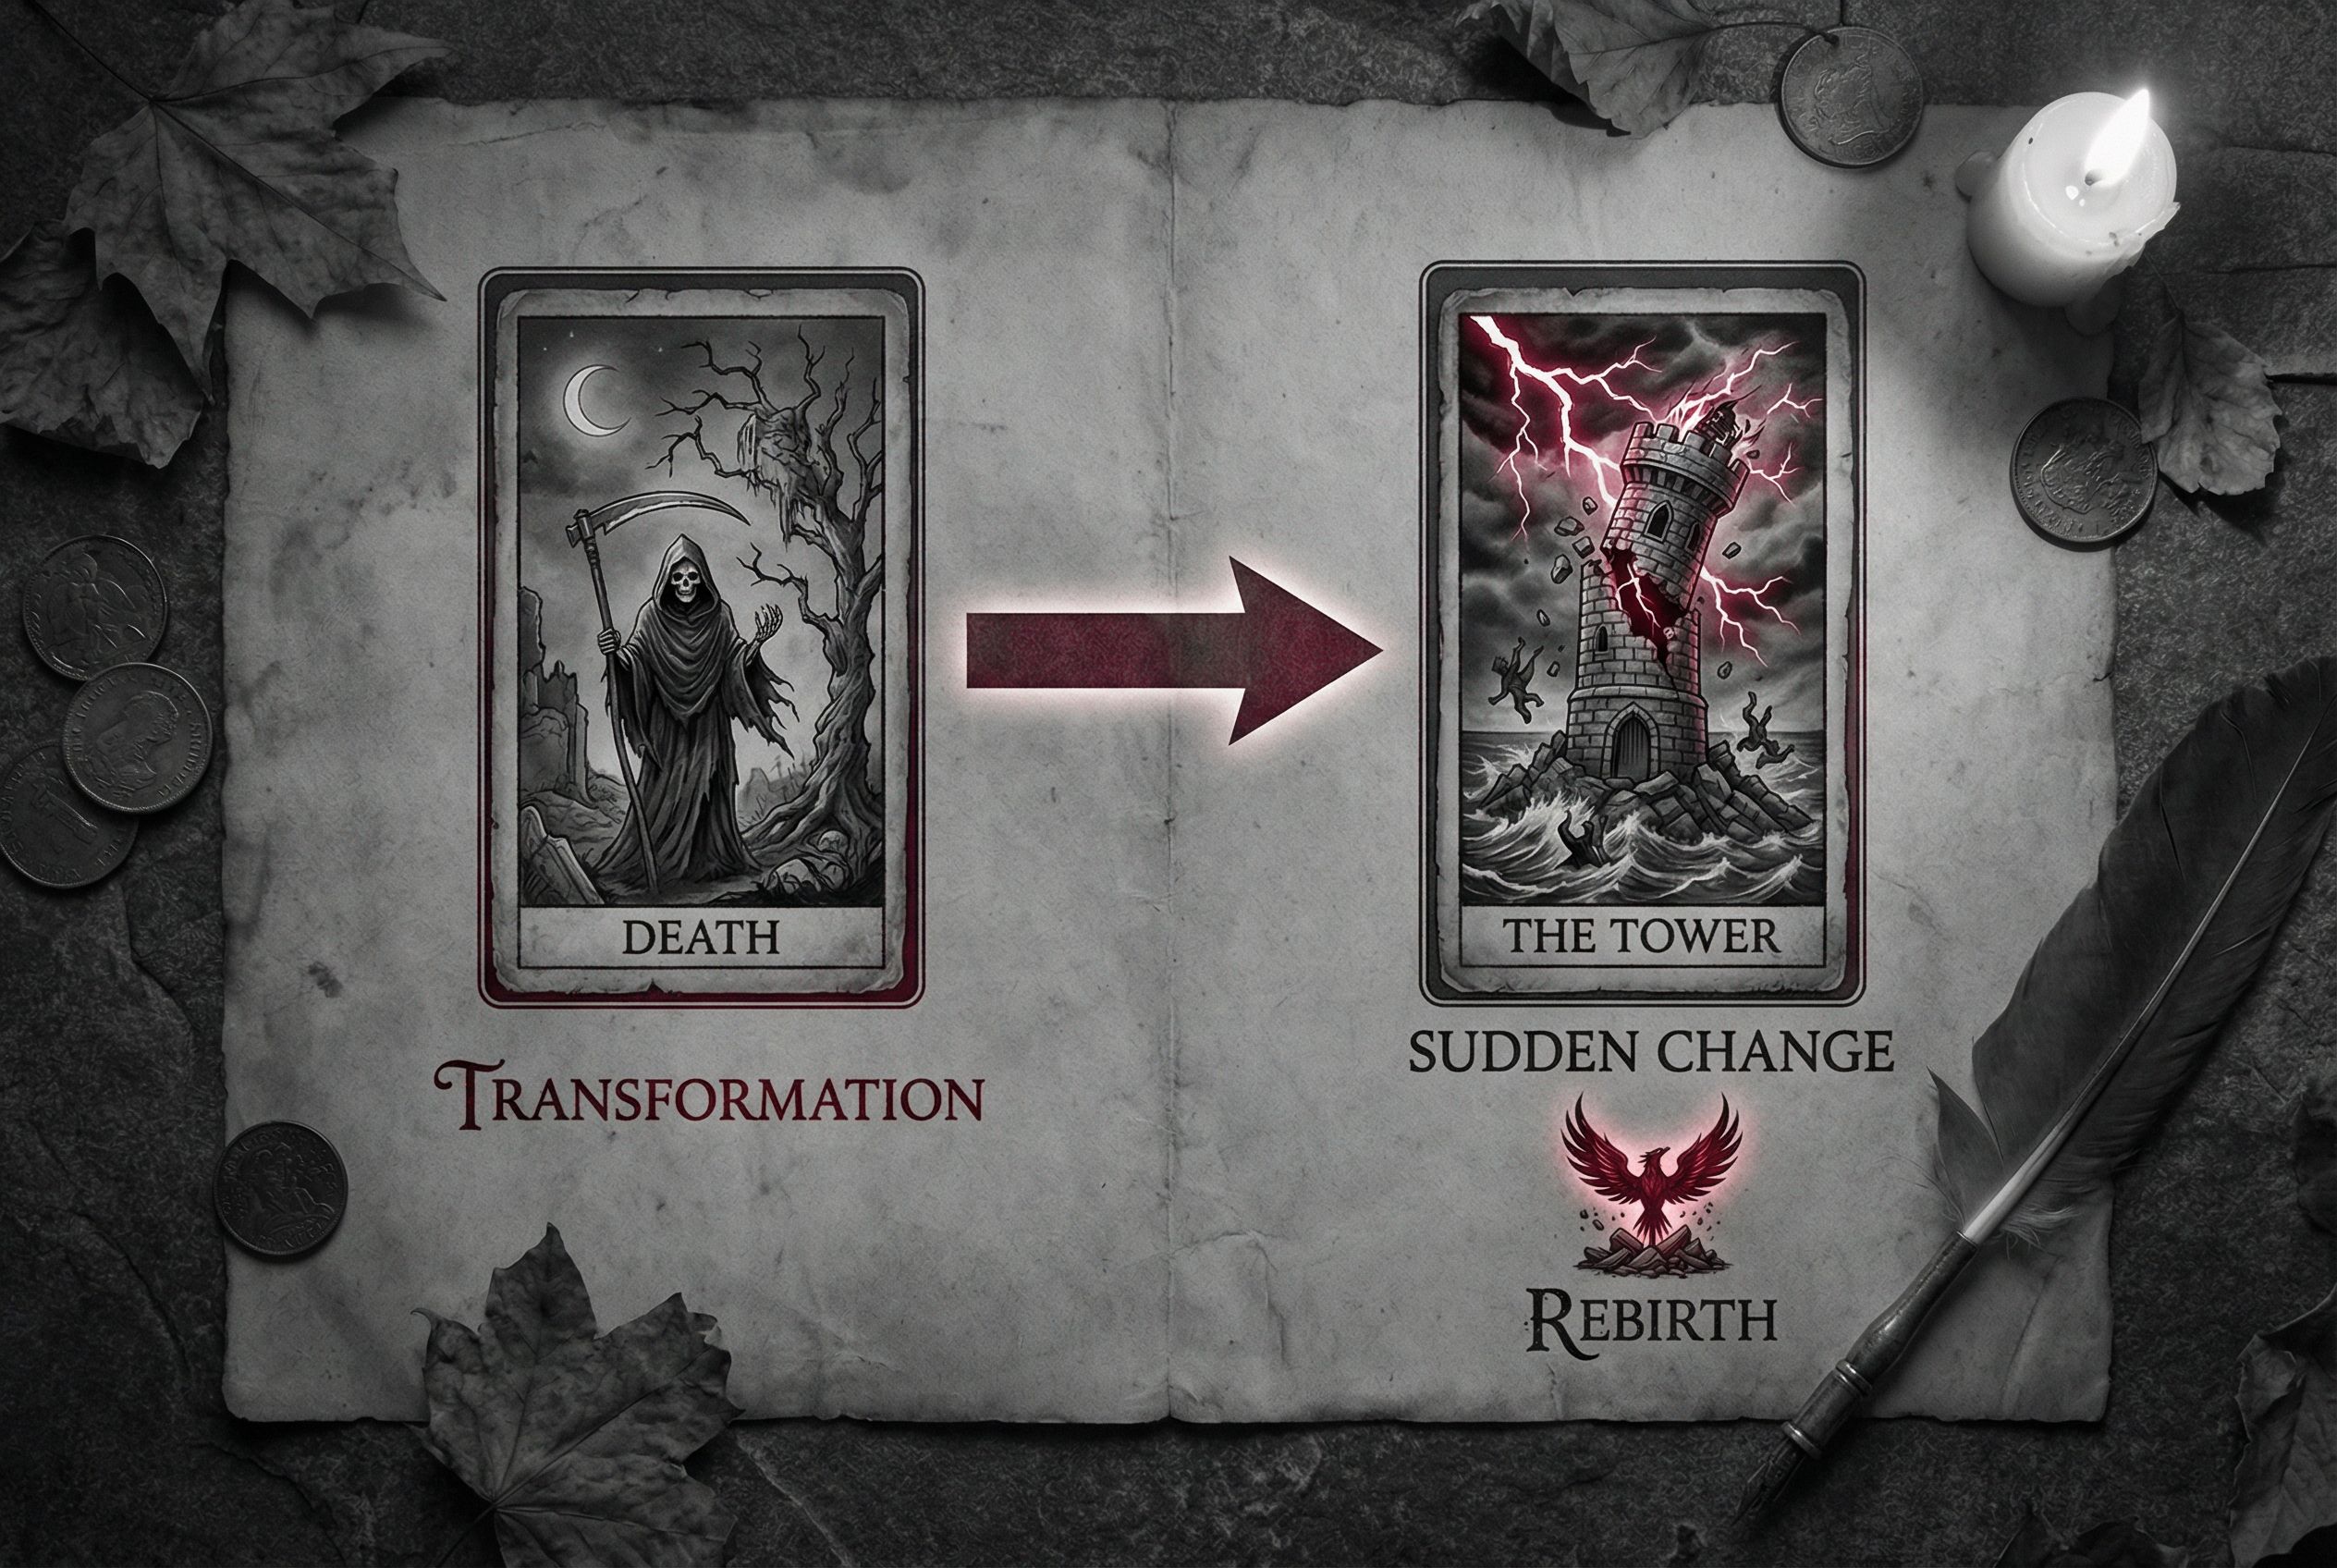
Prompt:
A dark, photorealistic tarot archetype relationship chart illustrating Death transitioning into The Tower. Use grayscale with subtle crimson accents, skeletal transformation motifs, lightning, collapsing structure, and rebirth symbolism. Clear diagram arrows show transformation preceding sudden change. Dramatic, high-contrast, cinematic mood.
Creative Ideas for Using Tarot Relationship Charts
You can apply these charts to:
- Tarot course modules
- Blog content
- Spiritual YouTube thumbnails
- Infographic handouts
- Social media posts
- Client reading summaries
- Tarot book illustrations
- Meditation guides
- Shadow work journals
- The more symbolic and emotionally resonant the chart, the more impact it will create.
Ready to Create Your Own Tarot Archetype Charts?
Nano Banana Pro makes it effortless to visualize deep symbolic connections between tarot archetypes.
Google Gemini 3 AI Model— The Most Intelligent AI Yet Gemini 3 was released on November 18, 2025. With a Read more

Want to see your dream room before spending a dime? Discover how an AI home design generator uses simple photos Read more

Need a logo but have zero design skills? Learn how to use an AI logo generator to turn simple words Read more
Looking for the best AI image to image generator? Learn how to style transfer, turn photos into cartoons, and keep Read more